How It Works
Minoma Analytics empowers your trading strategy by transforming years of market data into actionable statistical insights. Below, you’ll find an introduction to the Minoma Analytics platform, the key statistics it provides, and how these can enhance your trading decisions.
If you want to know more detailed information, there is an extensive tutorial series available in the Minoma Analytics Discord that covers everything in great detail. You can join our free Discord server by clicking here.
Understanding Minoma Analytics’ Core Functionality
Every timeframe—whether it’s daily, weekly, or hourly—has a highest and lowest price point. Minoma Analytics provides statistics that help you statistically determine the likelihood of these price points holding across multiple timeframes (weekly, daily, 8-hourly, 4-hourly, and hourly).
Leveraging years of historical data, the dashboard dynamically updates statistics for all assets and timeframes based on current price action, delivering tailored insights without the need for extensive manual input.
Key Statistical Insights Offered by Minoma Analytics
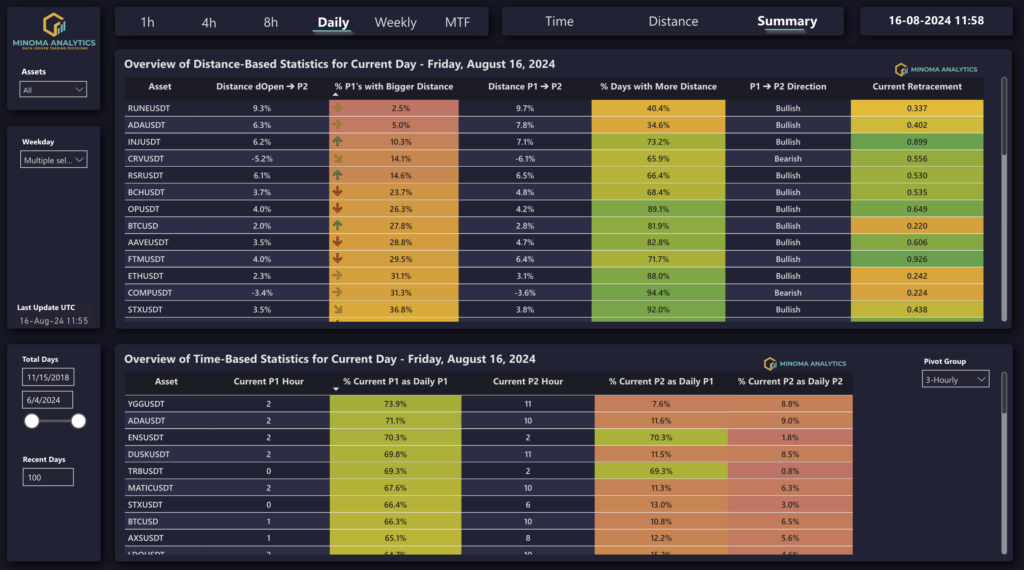
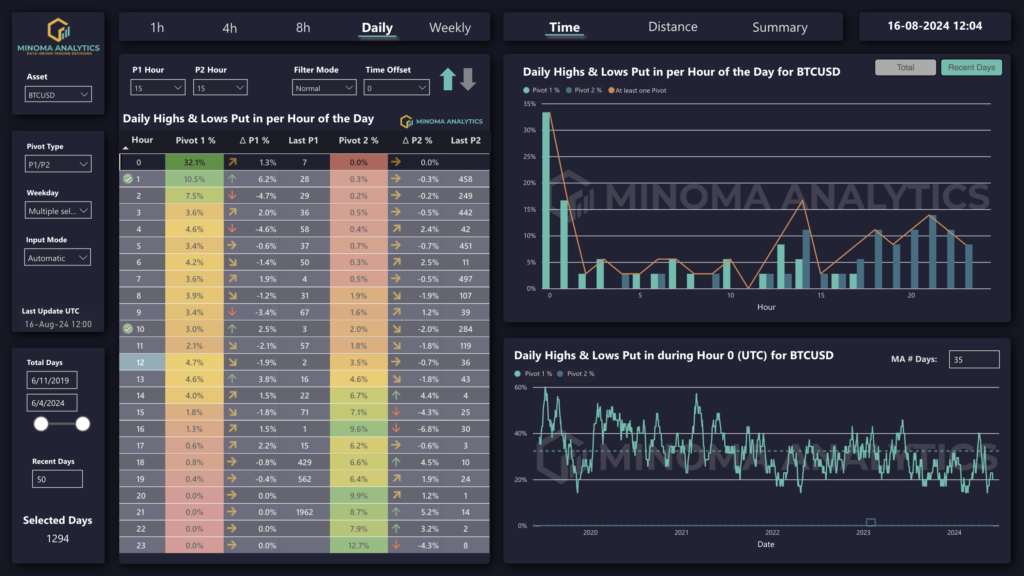
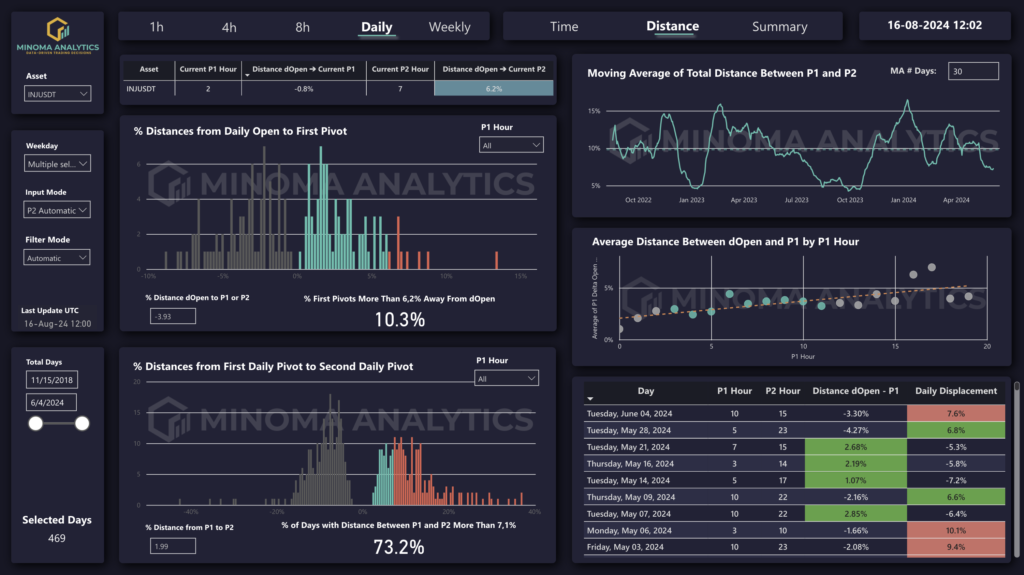
Minoma Analytics provides time-based and distance-based statistics that show when and where the highest and lowest points of a timeframe typically occur. Together, these statistics determine the strength of current price points.
Time-based statistics reveal whether a pivot was set during a high- or low-probability time, while distance-based statistics assess if it occurred in a high- or low-probability area and the likelihood of further price movement.
The Advantages of Using Minoma Analytics
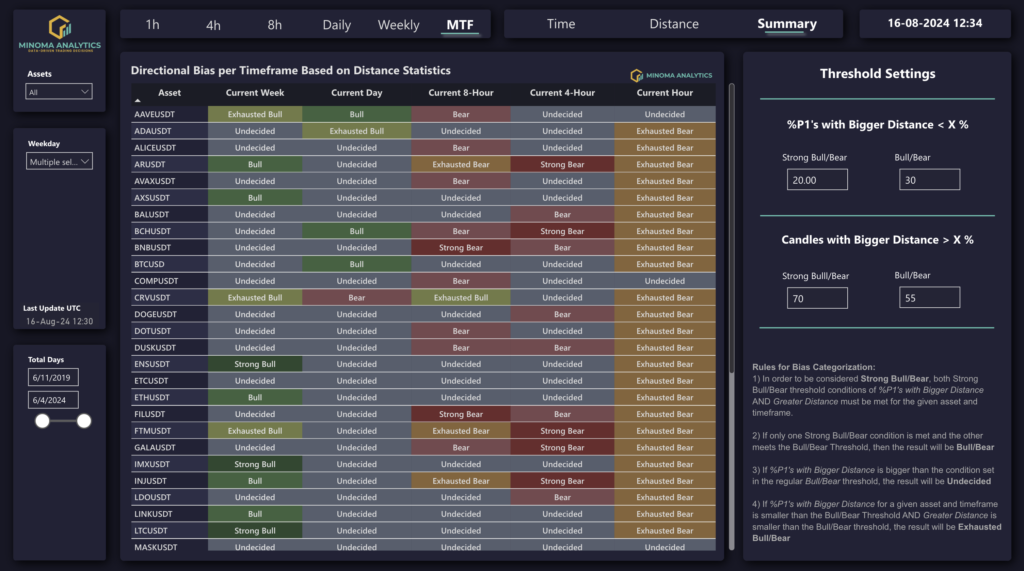
Knowing which pivots are likely to hold helps you determine your trading bias with statistical confidence. For instance, if the daily high is a high-probability pivot and the low is not, your bias should lean towards a downward move.
This helps you to stay on the right side of the market, determine take profit targets, and determine the invalidation price point (high-probability pivots) for your trade ideas.
There are Summary pages available that map the statistics to more easily to interpret statistical biases:
Is Minoma Analytics Right for You?
Minoma Analytics is best suited for intermediate and advanced traders. The statistics provided are powerful, but given their complexity, they are most effective when used by traders who already have a solid foundation in technical analysis and an established trading system.
If you are a beginner trader then we highly recommend getting a foundational knowledge of technical analysis and trading in general first.